Solar Roadways GIS Thought Experiment

Disclaimer: this is not meant to be a thorough analysis — rather, an exploration of an interesting concept using back-of-the-envelope calculations.  Additional investigations using the same (or more recent) data are encouraged, as is criticism.  And if anyone can find a location online with digitized parking lots, please let the lady know? The internet seems to have a dearth of ’em.

A lot of fuss has been caused recently by the Indiegogo Solar Roadways campaign.  People seem to have a great many Feelings for and against, but few commentators seem to be crunching any numbers.  Just how feasible could this idea be, for a relatively small community?

For this analysis, I’ll be using open-source parking lot and road shapefiles provided by the city of Bloomington, Indiana.  Surface area polygons for the former were created by using Feature to Polygon in ArcGIS’s Data Management toolbox; the latter by creating buffer zones of ~3 meters around road center lines.  Neither are perfect measurements, and neither are intended to be.

Map of Monroe county, Bloomington

Size of central Monroe county: 86.3 square miles
Surface area of parking lots: 6.11 square miles
Surface area of roadways: 2.5438 square miles
Number of households in Bloomington (2012 US census):  31,425
Average energy consumption of a household, 2012: 10,837 kWh per year
Annual energy requirements for Bloomington: 34,0552,725 kWh

Using this thing, with metrics from the Kyocera – KD-205GX-LP (which operates at 14% efficiency), in Bloomington, IN, a solar panel measuring a single square foot would be expected to glean 0.2 kWh per year.

SolarCalculator

1 square mile = 27,878,400 square feet
8.6538 miles  (from above calculations) = 241,254,098 square feet…

…which gives us a (rough) estimate of 48,250,819.6 kWh per year.  This more than covers the yearly requirements calculated before for Bloomington.

Of course, this isn’t taking into account the actual efficiency of Solar Roadways, rural households living outside of Bloomington, energy loss in transportation, [insert laundry list of items here], but it is interesting to think about.  Though large cities would have difficulty obtaining enough surface area for all their citizens, small communities could benefit greatly from the implementation of a program like Solar Roadways.


Donate to your local community college.

Stealing from a grad student friend at CalTech:

“Offended by rising college tuition costs? Pissed that Rice’s tuition has nearly doubled over 10 years? Or whichever university you graduated from that seems to be charging an arm and a leg?

Here’s an idea: instead of writing a donation check to your expensive alma-mater, write it to your local community college instead. They are institutions committed to providing a low-cost education, but they generally don’t see the sort of money that gets donated to four-year institutions, though I’d argue that they need it far more. In California, the situation is incredibly borked and local CCs have massive wait-lists for eager students.

[…My university] gave me so much, but I’d rather see my donations go to a school that keeps accessibility as one of their major goals.”

Absolutely in favor of donating to community colleges. They’re valuable resources for training a much-needed technical work force, and offer reasonable prices for most first-year college courses. They also provide excellent opportunities for students to find out what they *want* to study — without paying exorbitant prices at a four-year university. Definitely enjoyed everything I took from Houston Community College and Hill College. Both will be seeing a donation this year.

Everyone else on the internet is getting angry, so why not?

I feel awkward speaking toward the fiery PG comment wars specifically, because I’m friends with a few of the folks involved.  I also know a few people who lead women’s coding groups, and don’t want to detract from those initiatives.

Will say, however: whoever starts a women’s coding group should be certain that they’re doing it for the correct reasons. They should be inclusive of all genders / races / what-have-you; accepting, encouraging, and equipped to deal with a variety of experience levels; have a set, valuable curriculum; and try their best to make everyone feel welcome. The creator and the instructors’ primary motivations should also *not* be personal gain. This is the only way to provide a proper learning environment.

PyLadies Austin does this well, as do several branches of Girl Develop It.

I’ve been to a few “women’s coding events” where the vast majority of the instructors were male (think 90%) — men who spoke patronizingly to both the students and to the female instructors, and who seemed much more interested in appearing knowledgeable (or finding a girlfriend) than actually teaching.  Those events reinforce negative stereotypes, waste everyone’s time, and are toxic for all folks involved.  Again:  I’m not saying that every event is this way — most do their damnedest to have diverse representation, and go out of their way to make sure everyone is comfortable.  But there are a few groups who should sincerely question their motivations.

In the end, the best things you can do to raise the numbers of women in STEM fields are:  show ladies the cool things that can be accomplished with engineering / programming / science, hope they get inspired, and expose them to a variety of positive female role models (because they DO exist, and ARE badass).  So, uh:  what you would do to get anyone inspired in a particular field.

If you’d like examples of positive female role models in tech, Raquel Velez is one, as are Angelina Fabbro and Sara Chipps and C.J. Silverio — just to name a few.  Ask me if you’d like to see more.  (Pretty sure that John Resig made a list, even, a few months ago.)

tl;dr
Be respectful, be passionate, be vocal, encourage others to be the same.

“They don’t learn by understanding, they learn by some other way — by rote or something. Their knowledge is so fragile!”

(Definitely guilty of everything described.)

* * * * * * * * * * * * * *

(...this, too.)

RESOLVED:

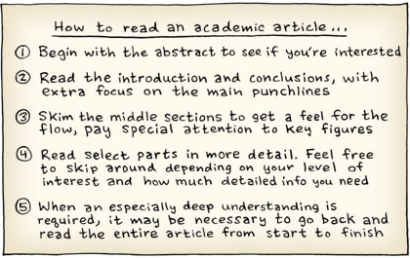
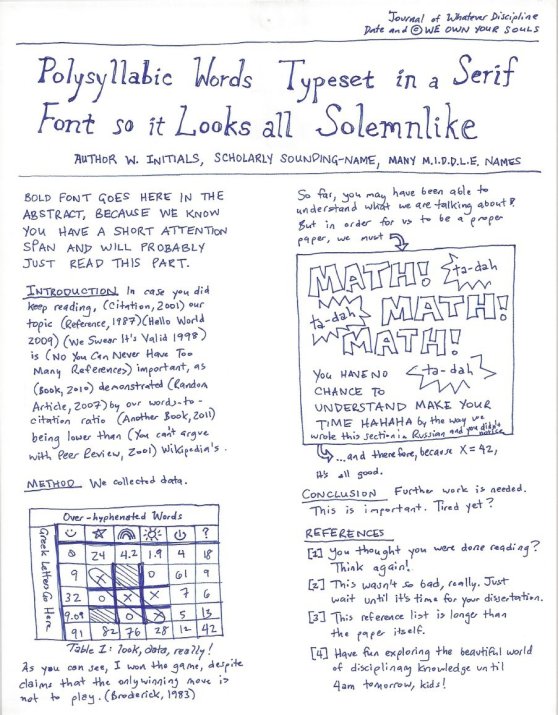
  • Journal articles are intended to convey information. They shouldn’t have to be systematically attacked and interpreted (…then reinterpreted) by the reader.
  • Abstracts and conclusions are less text-intensive than the body of the article, but are likely to be just as incoherent (less-structured, offering fewer figures).  Overall, this detracts from their use.
  • Images and figures should be the primary conveyors of information in any article. Terse prose is okay, and even encouraged, if meaning can be adequately conveyed with images.

I’m a huge fan of Bret Victor, particularly his paper “Scientific Communication as Sequential Art” (which is detailed in the first part of a lecture he did for the MIT Media Lab, “Media for Thinking the Unthinkable“).  In it, Victor redesigns a scientific paper as a series of captioned, dynamic illustrations within a comic-like format. The general meaning of the paper is preserved, and the reader is more likely to understand the presented concepts.  So, question: why hasn’t this been done for more journal articles, and for e-textbooks? Other question: why don’t we have textbooks specifically designed for digital reading?

Wolfram’s Demonstrations Project launched an attempt (sort of), presenting embeddable figures in a computable document format.  The CDF documents are free to create within Mathematica, and viewable by anyone who downloads the CDF player; however, there is little likelihood that the software’s code will be open-source — Mathematica (the tool for creating the documents) certainly isn’t — and I’m not aware of any projects working to create an alternative.  More complaints:  the Wolfram demonstrations project just focuses on visual representation of equations, and direct manipulation, but not on physical concepts and meaning.  Lots of pretty pictures, little understanding.

Physics, mathematics, biology, finance, and statistics are all obvious arenas for change in values over time — and all are heavily represented on Wolfram’s site.  There are even examples in the social sciences, in investment planning, and in journalism!  It’s troubling to see the earth sciences, astronomy, and materials science so under-represented, though — and especially troubling to see that the visualizations are being used on a small scale (i.e., one or two per page of obfuscated text, sans explanation).  Nothing akin to the sequential, related images and understandable prose in Victor’s presentation.

Speaking to what I know best: Geology is certainly an area where physical changes can (and should!) be dynamically and visually represented.  Descriptions of lithologies are inadequate; and, as helpful as large scale geologic maps and cross-sections happen to be, they would be infinitely more understandable if dynamically represented.  Can you imagine seeing a cross-section as its layers are deposited and subsequently deformed, over time?  With mouse-overs detailing properties of lithology, prospective stresses and strains, changes in porosities and permeabilities as strata are buried and undergo pressure?  Now imagine seeing that in three dimensions — and being able to scroll through the cross-sections in space, and in time.  Badass.

A scientist is only as good as her tools; and right now, the scientific community’s primary tool for communication is a low-bandwidth, almost incomprehensible, static page.  We can and must do better.

If you know of any software that speaks to these issues — preferably open-source software — please let me know!  I’d love to learn more about it, and to use it.

* * * * * * * * *

PS, for those who would be interested: purposefully not mentioning hyrdrogeology (i.e., the inadequacies of MODFLOW). That’s a whole ‘nother can of worms, for a whole ‘nother blog post.  (It hasn’t been modified in ages! The user-interface is terrible! Hydrologic visualization is terrible! Get off my lawn!)